In [1]:
%matplotlib notebook
import matplotlib.pyplot as plt
import numpy as np
import sympy as sy
from scipy.integrate import odeint
size = (12, 9)
from ipywidgets import interact, widgets, fixed
from math import atan2
Population Models
A simple example of a model involving a differential equation could be the basic additive population growth model. Here, suppose we have a constant rate of change \(k\). As a differential equation we would have:
We are familiar with the solution
In this notebook, we want to add complexity to this model and explore the results. Obviously, assuming a constant rate of change in a population model is a fairly naive assumption. Regardless, let’s quickly revisit our methods for visualizing and solving a differential equation expressed in this form.
In [2]:
x, k, t, P = sy.symbols('x k t P')
In [3]:
def dp_dt(x,k):
    return k
In [4]:
sy.integrate(dp_dt(x,k), t)
Out[4]:
k*t
In [5]:
x = np.linspace(0,10,11)
theta = [atan2(dp_dt(i, 1.1), 1) for i in x]
In [6]:
x = np.linspace(0,10,11)
y = np.linspace(0,10,11)
X, Y = np.meshgrid(x, y)
plt.figure()
plt.plot(X, Y, 'o', color = 'black', alpha = 0.6)
plt.quiver(X,Y, np.cos(theta), np.sin(theta))
plt.plot(x, 1.1*x + 4, '-k', color = 'red', linewidth = 4, label = 'Solution Curve for $k = 1.1$ and $c=4$')
plt.ylim(0,10)
plt.legend(loc = 'best')

Out[6]:
<matplotlib.legend.Legend at 0x119402ef0>
Exponential Growth
Last notebook, we saw the basic population model expressed as a differential equation. Here, we should recall our earlier work with discrete sequences and the passage to the limit that determines the change from \(\Delta P\) to \(dP\). We will rely heavily on this idea when modeling with differential equations. For the simple exponential population model, as a differential equation we have
whereas in the discrete case we have
Returning to a basic example, suppose we know a population has size \(P = 100\) at time \(t=0\). The population grows at a 0.24% growth rate. If we consider this in terms of our abover relationship as a way to approximate solutions every \(\Delta t = 0.1\), we get the following populations \(p_i\).
Problem: A certain city had a population of 25,000 and a growth rate of \(r = 1.8%\). Assume that its population will continue to grow exponentially at a constant rate, what population can its city planners expect in the year 2000?
In [7]:
r = 0.018
p0 = 25000
dt = 1

P = [p0]
for i in range(10):
    next = P[i]*(1 + r)*dt
    P.append(next)
In [8]:
P
Out[8]:
[25000,
 25450.0,
 25908.100000000002,
 26374.4458,
 26849.185824400003,
 27332.471169239205,
 27824.455650285512,
 28325.295851990653,
 28835.151177326487,
 29354.183898518364,
 29882.559208691695]
In [9]:
plt.figure()
plt.plot(np.linspace(1,10,11), P, '-o')

Out[9]:
[<matplotlib.lines.Line2D at 0x11946fd68>]
We are interested in the effect of varying some of the parameters of the differential equation. Here, we really only have two, the inital population and the growth rate. Let’s just vary the growth rate and describe the change in the resulting solutions.
In [10]:
def exp_grow(p0, r):
    P = [p0]
    for i in range(10):
        next = p0*r**i
        P.append(next)
    plt.figure()
    plt.plot(P, '-o')

interact(exp_grow, r=(1.00,2.0,0.01), p0 = (100,500,25));
The Logistic Differential Equation
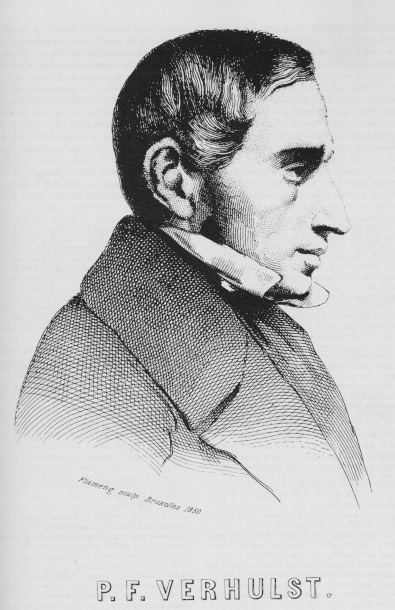
The logistic equation was introduced by Pierre-Francois Verhulst in a discussion on the United States population growth. In the middle of the 19th century, the United States was still expanding, and the population had followed exponential growth. This could not continue however, as “the difficulty of finding good land has begun to make itself felt.”
“the population tends to grow in geometric progression while the production of food follows a more or less arithmetic progression”–Verhulst 1845
This translates mathematically to the rate of births against those of deaths as a linear rate of change. We can examine this through an example.
Suppose we have a fish population that will stop growing at a population of 50,000. We also know that when the population is 10,000, the population doubles. Accordingly, if we plot population against growth rate we have two points \((10,000, 2)\) and \((50,000, 1)\). We assume this is linear, and have the equation:
In [11]:
plt.figure(figsize=(8,6))
p = np.linspace(0,74,2000)
r = 2.25 - .025*p
plt.plot(p,r)
plt.plot(50,1,'ro')
plt.plot(10,2,'ro')
plt.xlim(0,72)
plt.ylabel('Growth Rate r')
plt.xlabel('Population in Thousands')
plt.title('A linear change in growth rate')

Out[11]:
<matplotlib.text.Text at 0x119502b38>
Now we want to find some values. We can approximate these values using the earlier general population model. In this situation we end up with:
We will define a function to generate successive values of the sequence.
In [12]:
def logistic_example(N=100, x0 = 1000):
    x = np.zeros(N)
    x[0] = x0
    for n in range(N-1):
        x[n+1] = (2.25 - 0.000025*x[n])*x[n]
    return x

x = logistic_example(N=100, x0 = 1000)
In [13]:
n = np.linspace(0,10,10)
plt.figure()
plt.plot(n,x[:10],marker='o')
plt.xlabel('Year')
plt.ylabel('Population')
plt.title('Logistic Fish Population')

Out[13]:
<matplotlib.text.Text at 0x119431828>
In [14]:
def plot_logistic(i,x):
    plt.figure(figsize=(9,6))
    plt.plot(x[:i],'-ok', linewidth=2)
    plt.ylim(0,60000); plt.xlim(0,len(x))
    plt.xlabel('r'); plt.ylabel('x')
    plt.xlabel('Year')
    plt.ylabel('Population')
    plt.title('Logistic Fish Population')
In [15]:
x = logistic_example(N=20)
plot_logistic(len(x), x)

Experimenting with different rates
In general, we are dealing with the recurrence relationship
We’ve seen what happened in the fish population with a certain rate. Now we would like to see some other behavior by playing with values of \(r\).
In [16]:
def logistic_example2(r=1.0, N=100, x0 = 0.6):
    x = np.zeros(N)
    x[0] = x0
    for n in range(N-1):
        x[n+1] = r*x[n]*(1. - x[n])
    return x
In [17]:
c = logistic_example2(r=1.0, N=30)
print(c[:10])
[ 0.6         0.24        0.1824      0.14913024  0.12689041  0.11078923
  0.09851498  0.08880978  0.0809226   0.07437413]
In [18]:
def plot_logistic2(i,x):
    plt.figure(figsize=(9,5))
    plt.plot(c[:i], '-ok', linewidth=2)
In [19]:
interact(plot_logistic2, i = widgets.IntSlider(min=0, max=len(c), step=1, value=0), x=fixed(x));
/Users/NYCMath/anaconda/lib/python3.5/site-packages/traitlets/traitlets.py:567: FutureWarning: comparison to `None` will result in an elementwise object comparison in the future.
  silent = bool(old_value == new_value)
Changing r
We can see some different kinds of behavior depending on altering the parameters \(r\) and \(x_0\). Three things may happen. Recall our equation:
- The values of \(x_n\) get closer and closer to some limit value \(x_\infty\) as \(n \to \infty\).
- The values of \(x_n\) oscillate periodically among two or more values, repeating those values forever.
- The values \(x_n\) get larger and larger without bound.
In [20]:
x = logistic_example2(r=1.5,N=30,x0=1./10)
def plot_logistic2(i,x):
    plt.figure(figsize=(9,5))
    plt.plot(x[:i], '-ok', linewidth=2)
plot_logistic2(len(x),x)

Exploration
Playing with the sliders below, answer the following:
- For what values of \(r\) does \(x_n \to 0\)?
- What happens for slightly bigger values of \(r\)?
- Can you find values of \(r\) that generate periodic orbits (i.e., situation 2 from above list)?
- How many different points are visited in the periodic case?
- What happens for even bigger values of \(r\)?
- Make sure to try the value \(r = 3.83\). What do you observe?
In [21]:
def logistic(r=1.0, N = 100, x0=0.2):
    x = np.zeros(N)
    x[0] = x0
    for n in range(N-1):
        x[n+1] = r * x[n] * (1. - x[n])
    plt.figure(figsize=size)
    ax1 = plt.subplot2grid((1,8), (0,0), colspan=7)
    ax2 = plt.subplot2grid((1,8), (0,7), colspan=1)

    ax1.plot(x, '-ok', linewidth=2)
    ax1.set_ylim(0,1)
    n = int(round(N/5))
    ax2.plot([0]*n,x[-n:],'or',markersize=10,alpha=0.1)
    ax2.set_ylim(0,1)
    ax2.axis('off')
    ax1.set_xlabel('r'); ax1.set_ylabel('x')

interact(logistic,r=(0,4,0.01),x0=(0.01,1,0.1));
In [22]:
def bifurcation_diagram(r=(0.8,4),N=2000,k=2000,m=200,x0=0.2):
    """
        r: Pair of numbers (rmin,rmax) indicating parameter range
        k: Number of samples in r
        N: Number of iterations per sequence
        m: keep just the last m iterates
    """
    x = np.zeros((k,N))
    vals = np.zeros((k,m))
    rs = np.linspace(r[0],r[1],k)
    x[:,0] = x0
    for n in range(N-1):
        x[:,n+1] = rs * x[:,n] * (1. - x[:,n])
    return rs, x[:,-m:]

plotargs = {'markersize':0.5, 'alpha':0.4}
rs, vals = bifurcation_diagram()
plt.figure(figsize=size)
plt.plot(rs,vals,'ok',**plotargs);
plt.xlim(rs.min(),rs.max());
plt.xlabel('r'); plt.ylabel('x');
